Annexes
Memory limits
All the software running on the Analytical Platform has its memory controlled. Each running software container has a ‘requested’ amount and ‘limit’ available. Here’s an explanation of the key terms:
- ‘memory’ is needed for your app and code, but the limiting factor is usually the data that you ‘load into memory’. Data is in memory if it is assigned to a variable, which includes a data frame.
- a ‘container’ is for one user’s instance of a tool (e.g. Sandra’s R Studio or Bob’s Jupyter) or app (e.g. the PQ Shiny App or the KPIs Web App).
- ‘Requested memory’ is the amount the container is guaranteed. It is reserved for it.
- ‘Limit’ is the maximum amount of memory it can consume, if it is available. Your container is competing for this memory with other containers on the server it happens to be running on. If you try to use more than is available or more than the Limit then your container will be restarted.
e.g. Sandra runs her code in R Studio, which loads 8GB of data into a data frame, and she sees in Grafana that this takes 10GB of memory. This is above the minimum of 5GB, and because the servers aren’t too busy the extra 5GB are available. Later the server that her R Studio container is running on happens to get full and when she tries to do something that needs another 1GB memory (i.e. total 11GB) she finds that R Studio restarts, interrupting her work for a few minutes. She restarts her code, but because her R Studio now happens to be running on a different server that is less busy, she finds she can run her code and use 11GB fine.
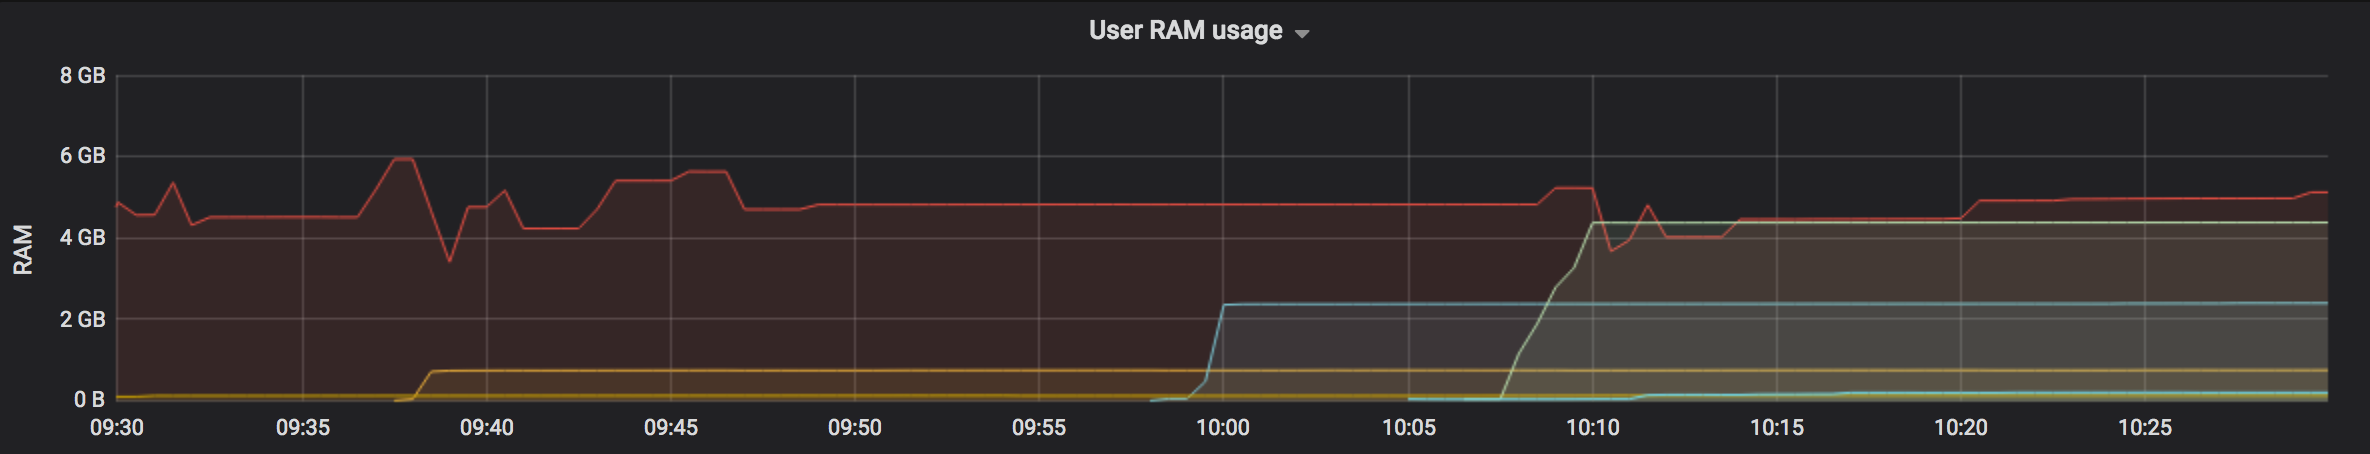
You can monitor your memory usage using Grafana (there is also a link from the Control Panel). To display your tool’s usage:
- Select the “Home” menu, then select the “Kubernetes / Pods” Dashboard
- In the “Namespace” box start typing your GitHub username then select it e.g. “user-davidread”
- In the “Pod” box select the tools - R Studio or Jupyter. It only shows ones which have been running recently.
- The “Memory Usage” shows a timeline. Compare your current usage: “Current: r-studio-server” with the corresponding “Requested” and “Limit” values.
- You may wish to adjust the time period shown, for example to “Last 5 minutes”, by clicking on the clock icon in the top-right corner.
Current memory limits:
| Container type | Requested | Limit |
|---|---|---|
| R Studio | 12 GB | 12 GB |
| Jupyter | 12 GB | 12 GB |
| App | 100 MB | 8 GB |
From November 2022 all tools (RStudio and Jupyter) are allocated with requests and limits set to the same value.
You can work on a dataset that is bigger than your memory by reading in a bit of the data at a time and writing results back to disk as you go. If you’re working on big data then consider taking advantage of tech like Amazon Athena or Apache Spark, which are available through the Analytical Platform too.
We are open to increasing the maximum memory, so let us know if you need more, to help us justify the additional cost.
See also the RStudio memory issues section.
Benefits of GitHub
Github is a central place to store our analytical projects - particularly those which are built primarily in code.
Github keeps track of who wrote what, when, why they wrote it, why we can trust its correctness, and which version of the code was run to produce an analytical result.
This is useful if you’re work on your own, but the benefits are greatest when you’re working in a team.
Here is some more details of what Git offers:
It provides a single, unambigous master version of a project. No more
model_final.r,model_finalv2_final.r. etc.It enables you and collaborators to work on the same project and files concurrently, resolving conflicts if you edit the same parts of the same files, whilst keeping track of who made what edits and when.
It enables work in progress to be shared with team members, without compromising the master version. You never get confused between what’s not yet final, and what’s trusted, quality assured code. The work in progress can be seemlessly merged into the master version when it’s ready.
It provides a history of all previous versions of the projects, which can be meaningfully tagged, and reverted to (undo points). e.g. we may wish to revert to the exact code that was tagged ‘model run 2015Q1’.
It reduces the likelihood of code being lost in messy file systems, such as on DOM1. Files sits within defined project ‘repositories’, with all code accessible from this location.
It provides an extremely powerful search function. The ability to search all code written by Ministry of Justice analysts in milliseconds. Or all code written by anyone, for that matter.
It enables an easier, more robust, more enjoyable approach to quality assurance. In particular, it offers the potential to continuously quality assure a project as it’s built, rather than QA being an activity that’s only done once the work is complete. For example, all additions to the codebase can be reviewed and accepted by a peer before being integrated into the master version.
It includes productivity tools like Github issues (essentially a tagged to-do list), and a trello style workflow (Github projects), with automation.
Git stores a huge amount of meta data about why changes were made and by whom. This dramatically reduces the danger of code becoming a ‘black box’. The to-do list is automatically linked to the implementation - e.g. The issue of ‘improve number formatting’ is automatically linked to the specific changes in the code that fixed the number formatting.
It makes it much easier to build reusable components, and make parts of our code open source (available to the public). For example, we use R code written by statisticians around the world that’s been put on Github, and we know that people across government have been using some of our R code. We can collaborate easily with other government deparments and anyone else for that matter.
It makes it easier to ask for help with your work, particularly with colleagues who are working remotely. You can hyperlink and comment on specific lines of code.
You can write rich, searchable documentation - e.g. this user guide is hosted on Github!
Finally, we have chosed git specifically because it seems to be by far the most popular version control system - see here and here
Reproducible Analytical Pipelines
The Reproducible Analytical Pipeline (RAP) is an alternative production methodology for automating the bulk of steps involved in creating a statistical report, interactive dashboard, or other analytical product. At its heart it involves replacing manual tasks with code, and usually includes:
- Organising repeated code chunks into functions that have been peer reviewed with associated unit tests, and ideally also organised into packages with relevant documentation and automated testing.
- Wrangling datasets into a tidy format, i.e. one variable per column, and one record per row, to faciliate analysis with vectorized functions.
- Managing dependencies inside virtual environments to facilitate reproducibility, using tools such as
renvfor R orvenvfor Python. - Using functions from public packages where relevant functions exist for the task at hand, rather than writing new ones with similar functionality. Where this is not the case and new functions would benefit others, they are contributed to other packages or added to a new package.
Packages developed within MoJ and hosted on GitHub designed to address tasks analysts commonly face in creating RAPs, such as the mojrap R package, will facilitate the creation of new RAPs when adopted more widely and contributed to. This will also promote the harmonisation of coding approaches across teams and reduce the duplication of similar functions.
For more information on RAPs, please see the following: RAP Manual, RAP Companion, or this blog post. Real life examples of RAPs created by MoJ analysts can be found on the DASD Automation Team’s website.
To engage further with the MoJ RAP community, please contact Aidan Mews to join the RAP publication group team on MS Teams, or join the #rap channel on Slack.
Step by step guide to setup Two Factor Authentication
Two factor authentication (2FA) is critical to the security of the platform. We have opted to use smartphone based 2FA apps due to the expense of giving out hardware tokens like the RSA device you use to log into DOM1.
Note that there are two layers of two factor authentication (2FA) in action on the platform:
Github Account 2FA Your Github account must have 2FA enabled. When you log in to Github, your session will stay active for a month before you need to re-enter your 2FA code. Your Github username identifies you to the platform, and we use this identity to control access to data and other resources once you’ve logged into the platform. You therefore must be logged into Github to use the platform.
Analytical Platform 2FA Your Analytical Platform account has a separate 2FA step. You will be prompted to set this up the first time you access the platform. This code must be entered once a day. This security step lets you log into the platform and use it.
Usually, when you log into the platform, you will be prompted to enter your platform 2FA, but you will not need to enter your Github 2FA because this is remembered for a month.
However, if you have not logged into the platform for more than a month, you will first have to login to Github (and enter your Github 2FA code), and you will then also be prompted to enter your platform 2FA code.
Step by step - logging into the platform for the first time
The first time you log into the Analytical Platform, you will be asked to set up 2FA.
Your welcome email will direct you to the platform Control Panel.
Step 1: Log into Github to identify yourself to the Analytical Platform
If you’re already logged into Github, you will not see the ‘Sign in to GitHub to continue to Analytics platform’ screen.
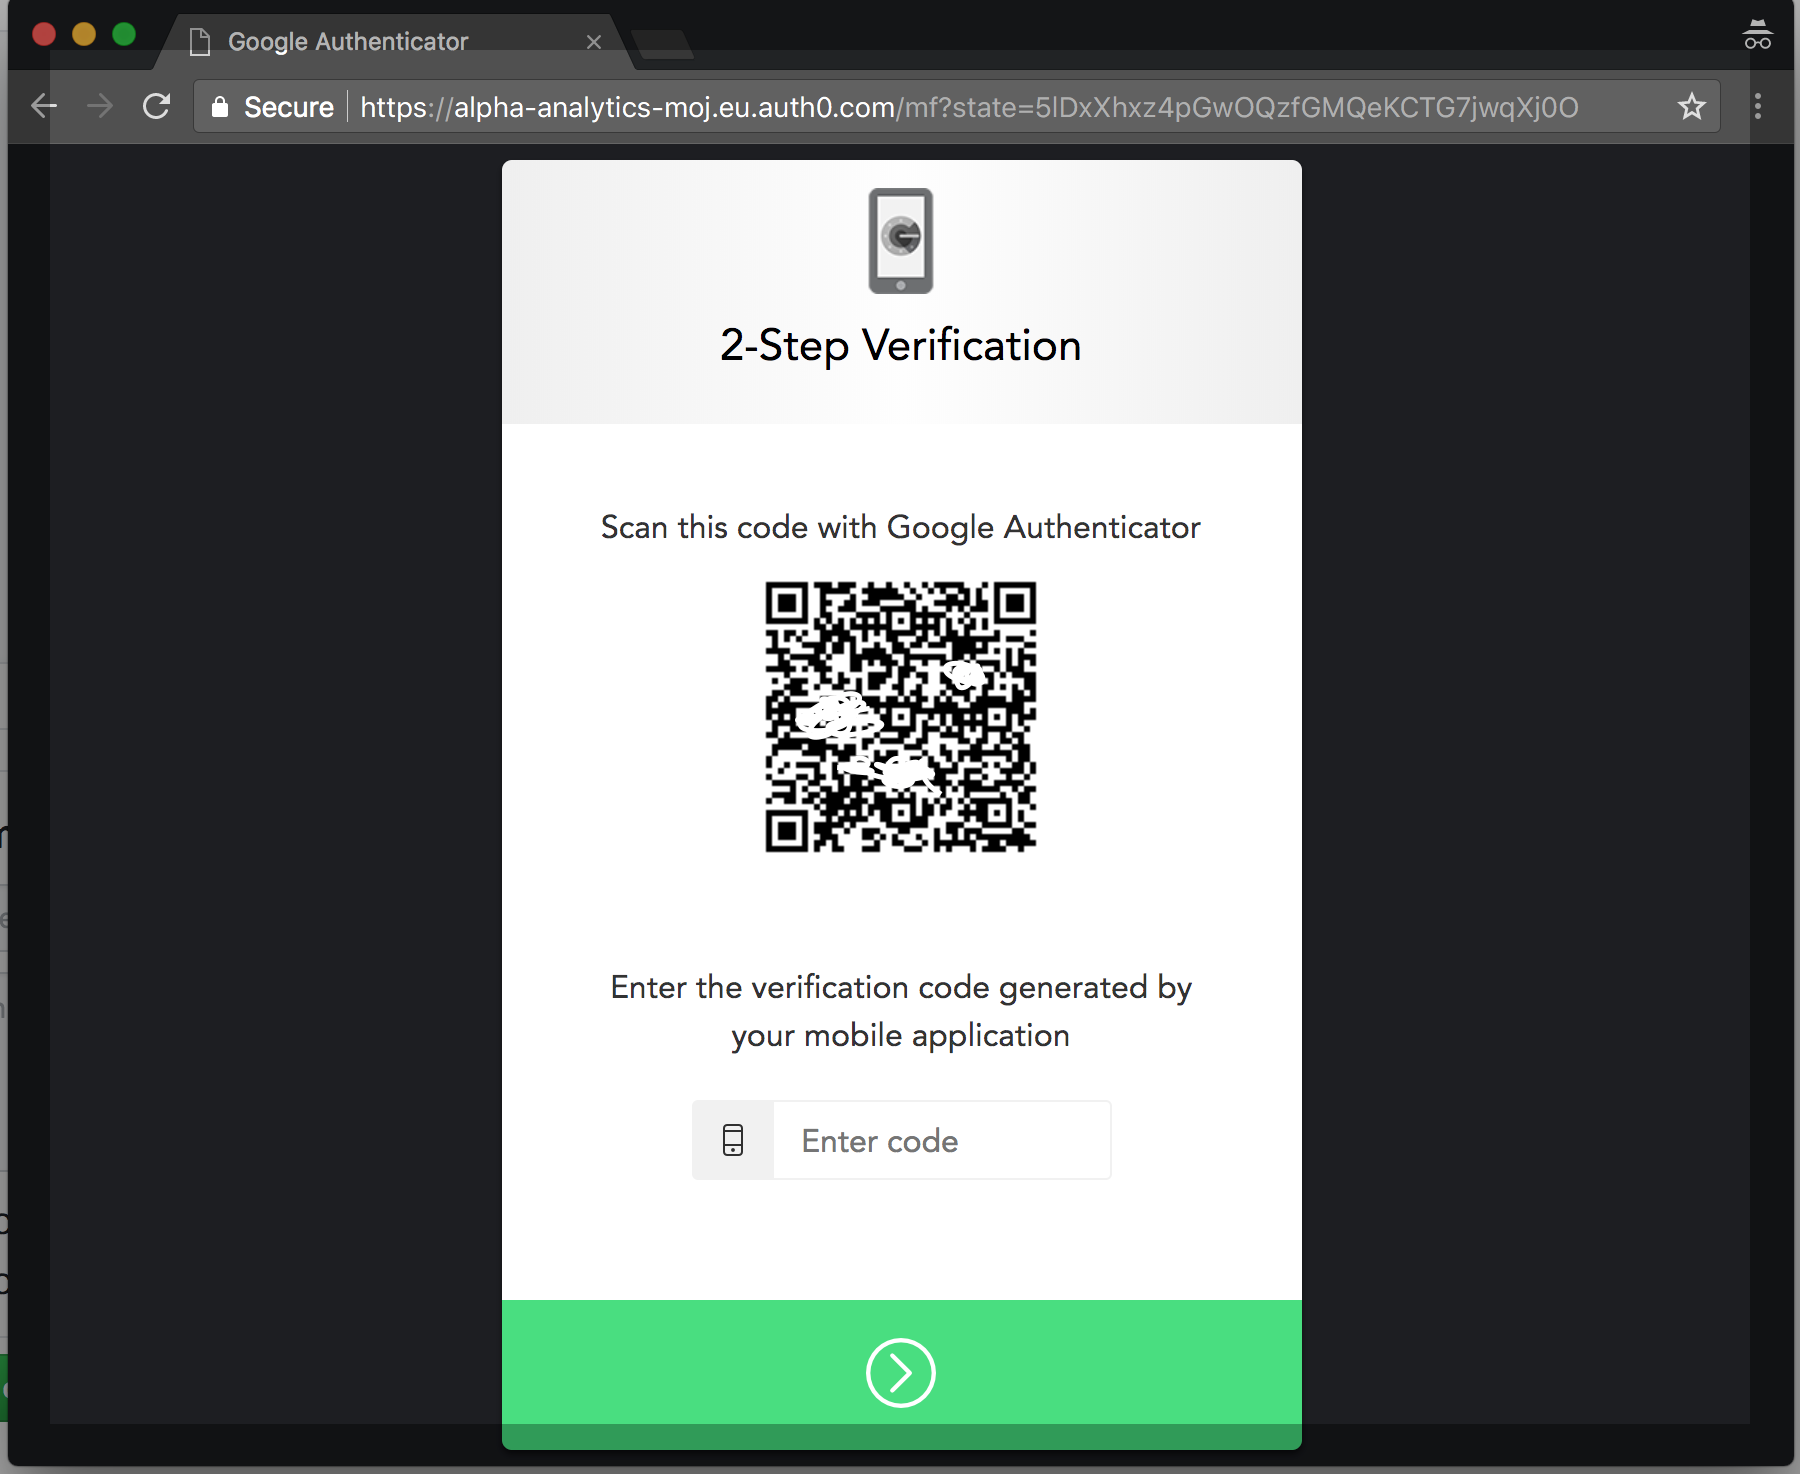
Step 2: Set up your Platform 2FA using your smartphone
In this step, you set up the second layer of 2FA, your Platform 2FA.
Scan the code using your smartphone app, and enter the code that comes up on your smartphone.
Note: If you get the error ‘Wrong or expired code’, you need to make sure that your phone’s clock is accurate. See here
You’re now done
Once you’re entered your platform 2FA code in the interface above, you should now have access to the platform. You will need to enter your platform 2FA code around once a day as you use the platform.
Infrastructure Migration - step by step instructions
- Before upgrading make sure that you and your teams have pushed everything to GitHub or saved to s3 as the home directories will be wiped
- We will ask for your GitHub username so we can enable the upgrade on our end
- Once we do that, when you log in again to the AP, you will see the following message: ‘You are now eligible to upgrade. Please click here’
- The URL link for the AP will change, so as soon as you upgrade make sure you save the link
- The Control Panel is not changing at all, so once you are on the Tools page just choose what version of Tool you want to deploy 6.Once you deploy the tool, you will have to reconnect to Github by setting up your SSH keys again for each tool, following the user guidance
- You are now done